- Register for iLab Operations Software- [Registration guide]
- University of Arizona KFS accounts may be used to pay for services rendered. The account must be current, and contain sufficient funds to cover the charges. External users may pay with PO, Check or Credit Card.
- Once your account and lab group has been created, you can begin submitting sample information. Please be sure to complete the online iLab order before bringing the templates to the lab in the Keating Building drop off location of Life Sciences South Room 205
Our facility is located in the Thomas W. Keating BioResearch Building Room 106 (map). Label your submission with the Numbers at the end of your Service ID. Please leave your submission in the freezer outside the door. Sequencing staff members will check in your submission online.
Users at the south side of campus may drop off their templates in the refrigerator in Life Sciences South Room 205. There is a daily pickup from that location.
Remote users can mail their samples to the following address (If you are sending plates please see our 96-well plate and cap guidelines below):
Arizona Genetics Core - DNA Sequencing
Keating Building
1657 E. Helen St. Rm 106
Tucson, AZ 85721-0240
Tubes - Snap cap tubes may be secured with parafilm (if you are shipping materials) and/or organized in a box to prevent opening during transit. If you are using our DNA extraction or cell line service you can send samples in screw cap tubes with an O-ring to prevent cross-contamination.
Plates - Plates sealed with strip caps are preferred since they are most stable during transit. We recommend the following part numbers or similar - USA Scientific plates PN: 1402-9600 and USA Scientific Strip caps PN: 1400-0800. Temperature and pressure variations can affect adhesive seals and samples may arrive contaminated or displaced.
Submitting DNA Templates:
Submit all samples in 1.5mL tubes. Write the name of the template exactly as it appears on the website work order. On the side of the tube, write your name and the tracking number from the website. Please note in the comments section of your work order if you anticipate a difficult template (e.g. GC righ). If the template is to be used for more than one sequencing reaction, submit only one tube with enough DNA for all of the reactions.
Required Volumes for Submission:
Template - 8 µL/reaction
Primer - 5 µL/reaction
All low volume submissions should be given in 1.5mL eppi tubes. Sample and primer must be submitted in separate tubes for low volume sequencing.
All high volume plates should be submitted in a v-bottom plate.
The most important factors are concentration and purity. We strongly recommend that all PCR products be prepared with commercially available PCR cleanup kits to remove excess primers, nucleotides, and buffers. The most commonly used PCR purification kit among our users is Qiagen's QIAquick PCR system.
Important! Do not use buffers containing EDTA (such as T.E.) to resuspend your templates. This will cause your sequencing reaction to fail. We recommend submitting samples in sterile ultrapure (MilliQ) water.
| Template | Concentration | *total DNA/reaction |
|---|---|---|
| Plasmids (up to 10 KB including insert) | 200 ng/µL | 500 ng |
| Plasmids (over 10 KB including insert) | 200-400 ng/µL | 500-1000 ng |
| BAC DNA | 1-2 µg/µL | 5 µg |
| Cosmids, Phage DNA | 1 µg/µL | 2.5 µg |
PCR: Optimum concentration depends on the length. Use the formula: length (base pairs) x 0.02 = concentration (in ng/µL)
* Templates at optimal concentration use a standard 2.5µL of template per reaction. If template concentration is lower than ideal concentrations, we can use up to 8 µL of template. When you submit your sample online, please enter correct concentrations. Our computer will then calculate how much template will be optimal in your reaction.
Primers: 3-5 pmol/µL (3-5 µM)
Note: for a 20-mer primer this is 20 ng/µL
- Templates prepared in 96-well format
- If using more than one primer on the plate, please provide a plate with primers in the wells corresponding to the proper template locations.
- DNA must be of high purity and consistent concentration for best results. The 3730xl sequencer is very sensitive to salts. Users wishing to use the facility's automated sample cleanup, quantification, and normalization services should select these options in iLab at the time of submission.
- Optimum concentration for PCR products is 10 ng/µL & for plasmids 50 ng/µL. Please supply at least 8 µL of template for each reaction to be performed.
- Optimum primer concentration is 3 pmoles/µL. Please supply at least 4 µL of primer for each reaction to be performed.
DNA sequencing is run on an Applied Biosystems 3730XL DNA Analyzer. The user can expect up to 600 bases of reliable sequence per read in one direction.
The average turn around time on the low volume sequencing service is 3 business days. For the high volume service, expect results in 2-3 days.
The files that our automated sequencers generate require specialized software in order to be viewed. As you might expect, these viewers are platform specific. Please see the notes at the bottom of this page on how to configure your computer's file associations so that the files will open when you click on them.
There are several free viewers that are available to look at the electropherograms. Below are a few of the options. These programs are for viewing individual sequence files. If you need assistance with large scale sequencing data management, please feel free to contact us for assistance or recommendations.
Chromas
Chromas is freely available over the web, and offers many options for working with .AB1 files. It is a trace viewer for the PC platform (all Windows OS™s are supported). Follow the link above to download.
Snap Gene Viewer is a free download to view traces. Editing is not supported with the free version
Geneious Prime- UArizona License for UArizona users
Must authenticate by NetID. Select "Geneious Prime" from available software once logged in
- Windows: Download the first chromatogram file, and then double-click it. A window will pop up telling you it doesn't know how to open the file. It will offer to let you browse for the correct application. Do so - choose the chromat viewer you downloaded above. Windows should thenceforth remember what program to use. You can continue to download the rest of your files.
- Mac OS X: Download the first chromatogram file, then single-click it and type command-I ('Get Info'). In the subsequent window, click the arrow next to 'Open With:' and in the pop-up menu button underneath, browse for the chromatogram viewer application you downloaded (above). You may wish to click the 'Change All' button, to indicate to your computer that it should always use that application for 'AB1' files.
The electropherogram is a graphical representation of the fluorescent dye intensity over time. The electropherogram can be used to provide the user with valuable information regarding the quality of their template. Please note, however, when the template does not generate readable results an electropherogram still must be sent for billing purposes. In this case, we truncate the electropherogram to about 30 bases.
Following is a guide developed to make analyzing your electropherograms a little simpler.
Noisy Sequence -
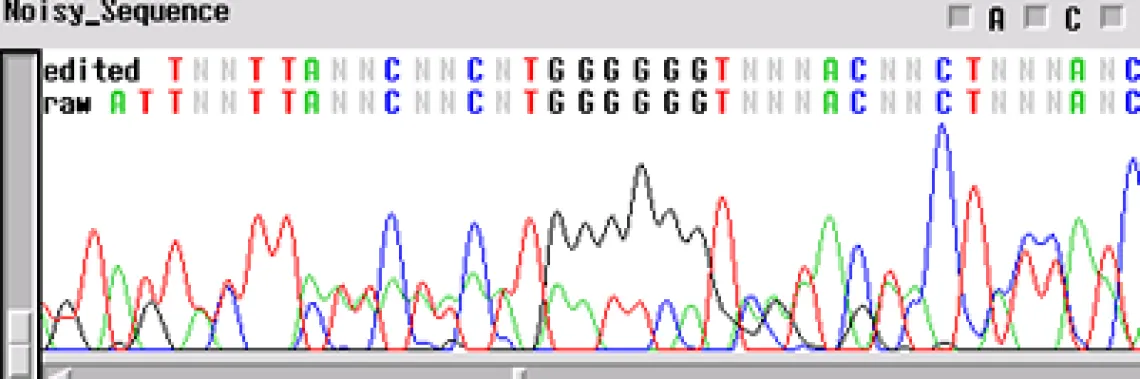
If your template is "noisy' - the electropherogram will show multiple peaks underneath and on top of each other. This is commonly found with PCR products amplified directly from genomic DNA. If several products are amplified from the template, and a single product is not isolated using either gel extraction or another technique, the primers will sequence multiple products. This is the case when you have a normal signal strength, yet there are several peaks in a single location
- Is it possible that your primer has more than one binding site and you are getting multiple sequences atop one another?
- Is your template contaminated by another fragment that generated peaks underneath the desired sequence?
Not enough DNA Template -
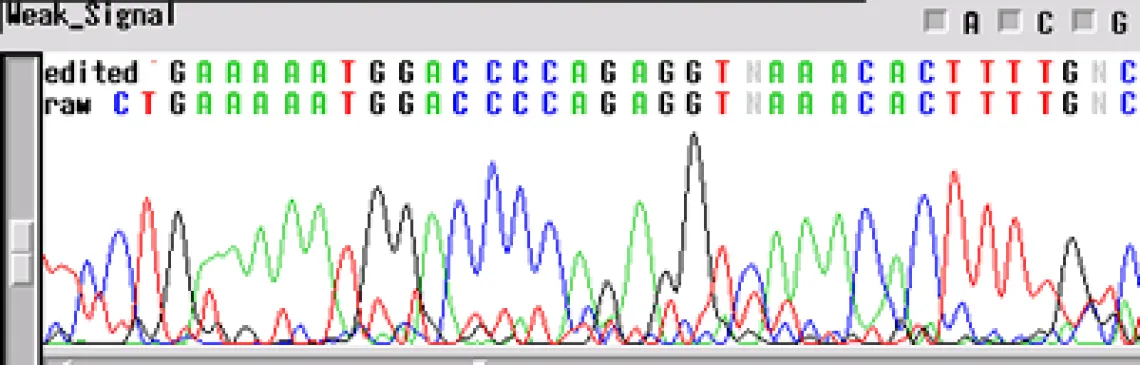
If your sequence has a "weak signal strength" - peaks are low, the signal intensity <100 RFUs for each base, and low signal-to-noise-ratio- your template concentration may be too low for the reaction. The concentrations listed above are for "ideal" templates. Difficult templates may need more DNA to get through certain regions, e.g. long inserts, secondary structures, homopolymers and microsatellites. An increase in template concentration (10X) can often result in a cleaner sequence. Other possibilities include:
- Primer concentration is too low
- Mismatch in the primer sequence - A single mismatch can cause the signal to decrease by ten-fold
Homopolymer -
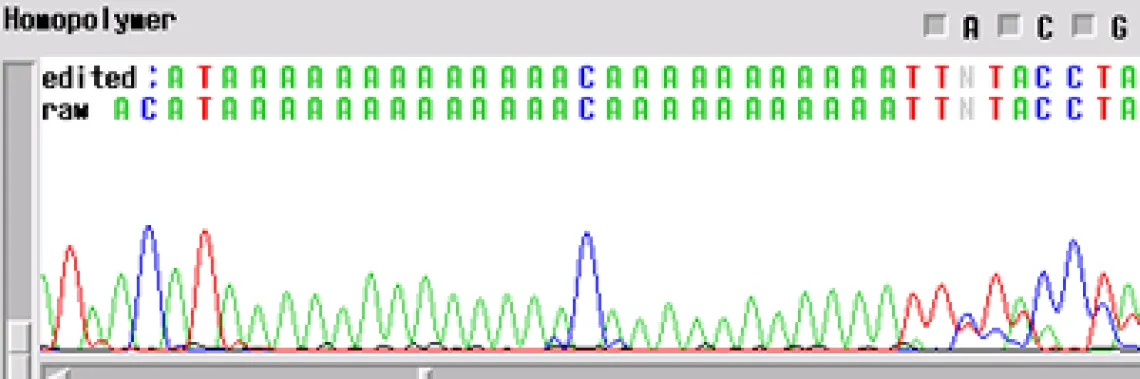
Your template generated a sequence with a "homopolymer region". A homopolymer is a region of repeated bases of varying length. Often, if you can an email mentioning a homopolymer, this means that the enzyme slipped at the homopolymer and the sequence following is noisy and can cause inaccurate base calling by the computer.
Microsatellite -

A microsatellite region can cause the same problem. There are not too many tricks to get through these regions. The best first step is to run the sample with a primer in the reverse direction so you can obtain sequence on the other side of the region.
Signal Dies Off -
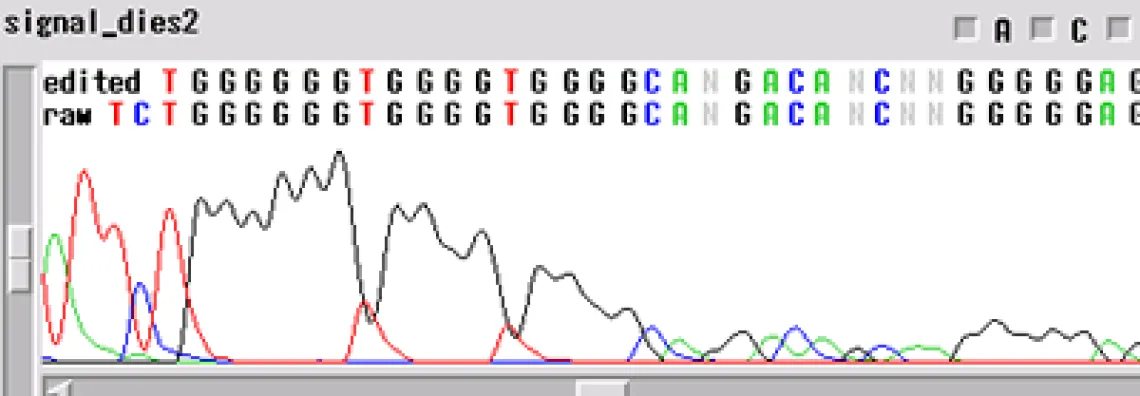
Your template generated a sequence that "dies off prematurely" - the sequence will look fine and then either end rapidly before the end of your fragment or slowly towards the end of the fragment.
When the template dies off, there are a few things to think about:
- Is it possible that the enzyme is encountering a secondary structure that it cannot get through?
- Could there be a contaminant left over from the prep of the sample or the sample itself?
G-C Rich Sequence -
Is the template G-C rich? There are a few things we can do if this is the case. We can try cycling with a higher temperature to help denature the template. We can run the template with 5% DMSO in order to break the GC bonds. Adding DMSO interferes slightly with the reaction and is not recommended for low concentration templates. Please let us know if you know your template is G-C rich.
Clean Vector, Noisy Insert -
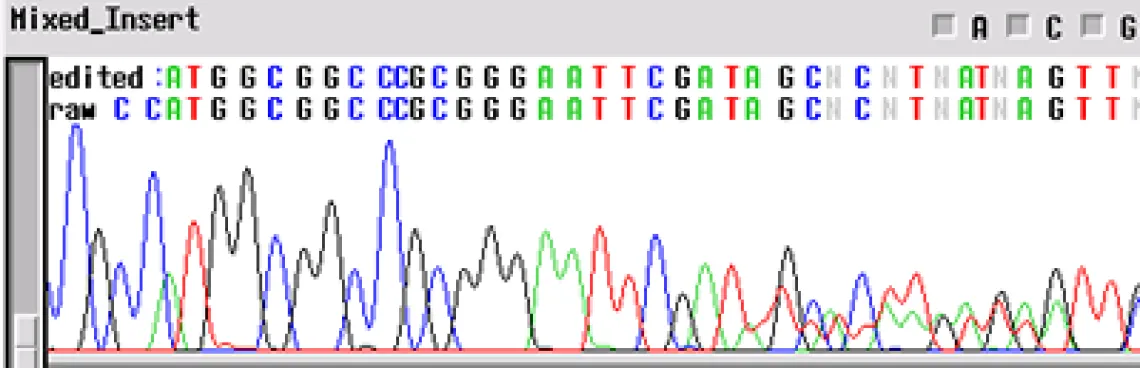
Your template appears to have a "noisy insert with a clean vector" - the electropherogram will be good up until about 70-80 bp and then the template appears noisy. This problem is usually the product of multiple inserts (PCR of clones from colonies - another colony nearby). When a subcloning procedure allows the insert to be oriented in either direction in the vector, positive colonies can have different sequences. If two positive colonies grow extremely close together and have different orientations of insert, the electropherogram will have clean peaks until the site of insertion where the sequences get mixed.
No Sequence -
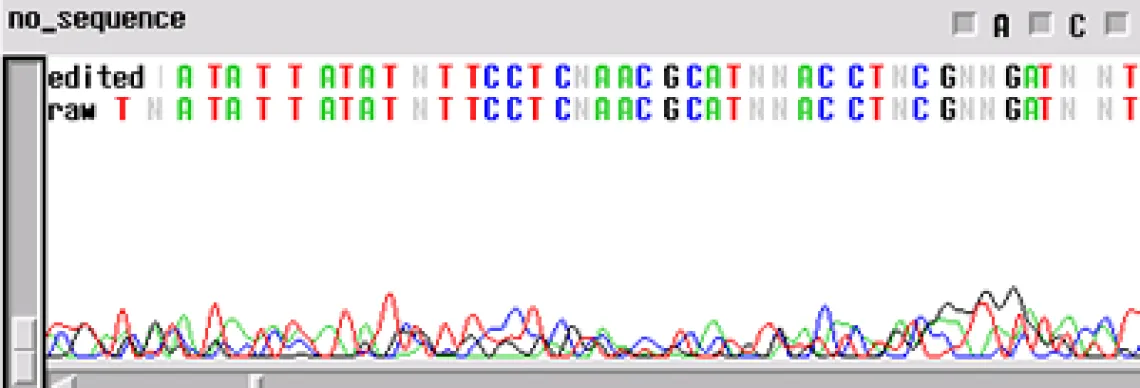
Worst problem of all. Your template generated "no readable sequence". This could be caused by a number of different problems, some of the more common causes are:
- Not enough template DNA to generate visible results
- Not enough primer to generate visible results
- No primer site on the template DNA corresponding to the oligo in the reaction
- High enough concentration of contaminant to completely cease enzyme activity
Arizona Genetics Core will archive DNA templates for 3 months. If you can provide the date when the template was run, and the name of the template, we will be able to return it to you (or use it in another sequencing reaction). After 3 months we will not be able to access your sample.
If you do not find answers to your specific sequencing questions here, please do not hesitate to contact us directly at (520) 621-9791 or email azgc@arizona.edu.